Creative work does not scale on talent alone. As the Swedenborg Foundation expanded production across multiple shows, channels, and content formats, the challenge became building a system that could support consistent creative output without relying on last-minute problem solving or individual memory.
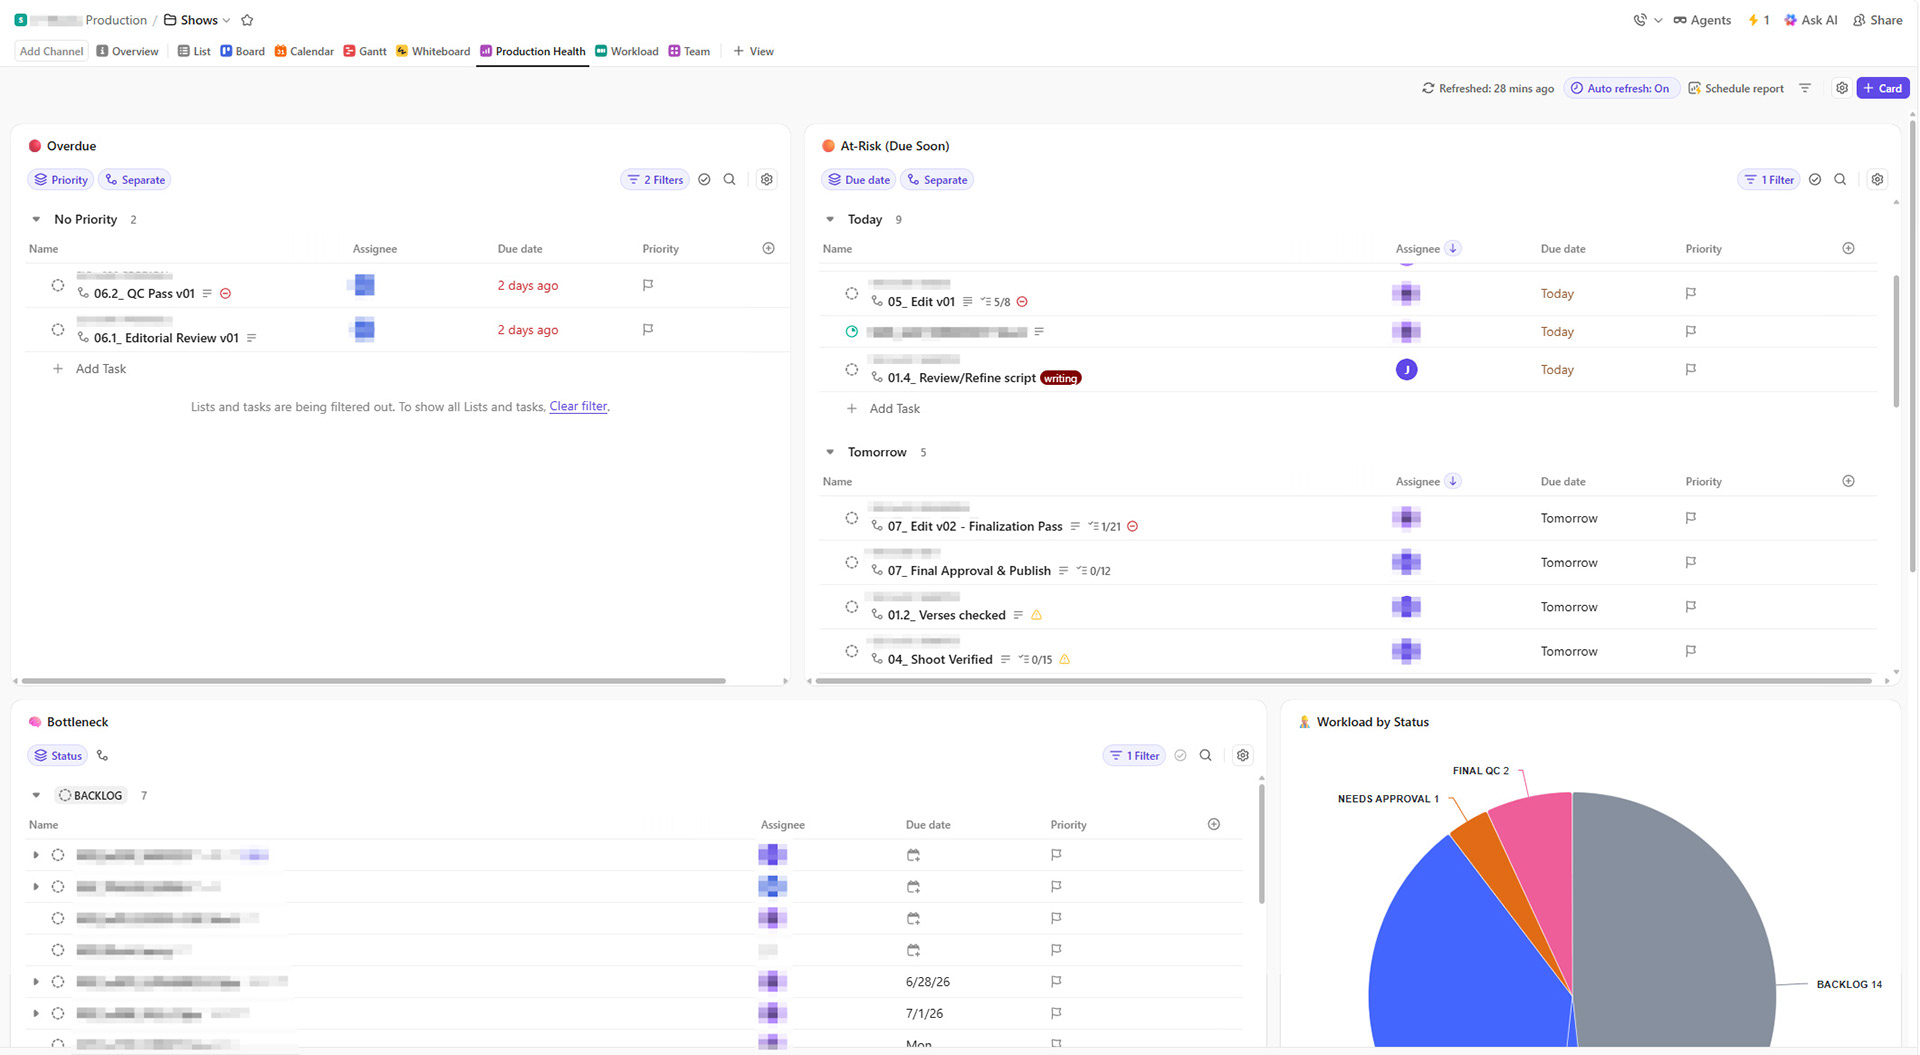
An example of our Production Health Dashboard - built to identify the overall health of our production output.
Role
Creative Production Director
I designed and now oversee the production systems that help the Programming team plan, track, prioritize, and release content across multiple active projects. This includes ClickUp infrastructure, production dashboards, workflow models, goal tracking, task visibility, and team coordination rhythms.
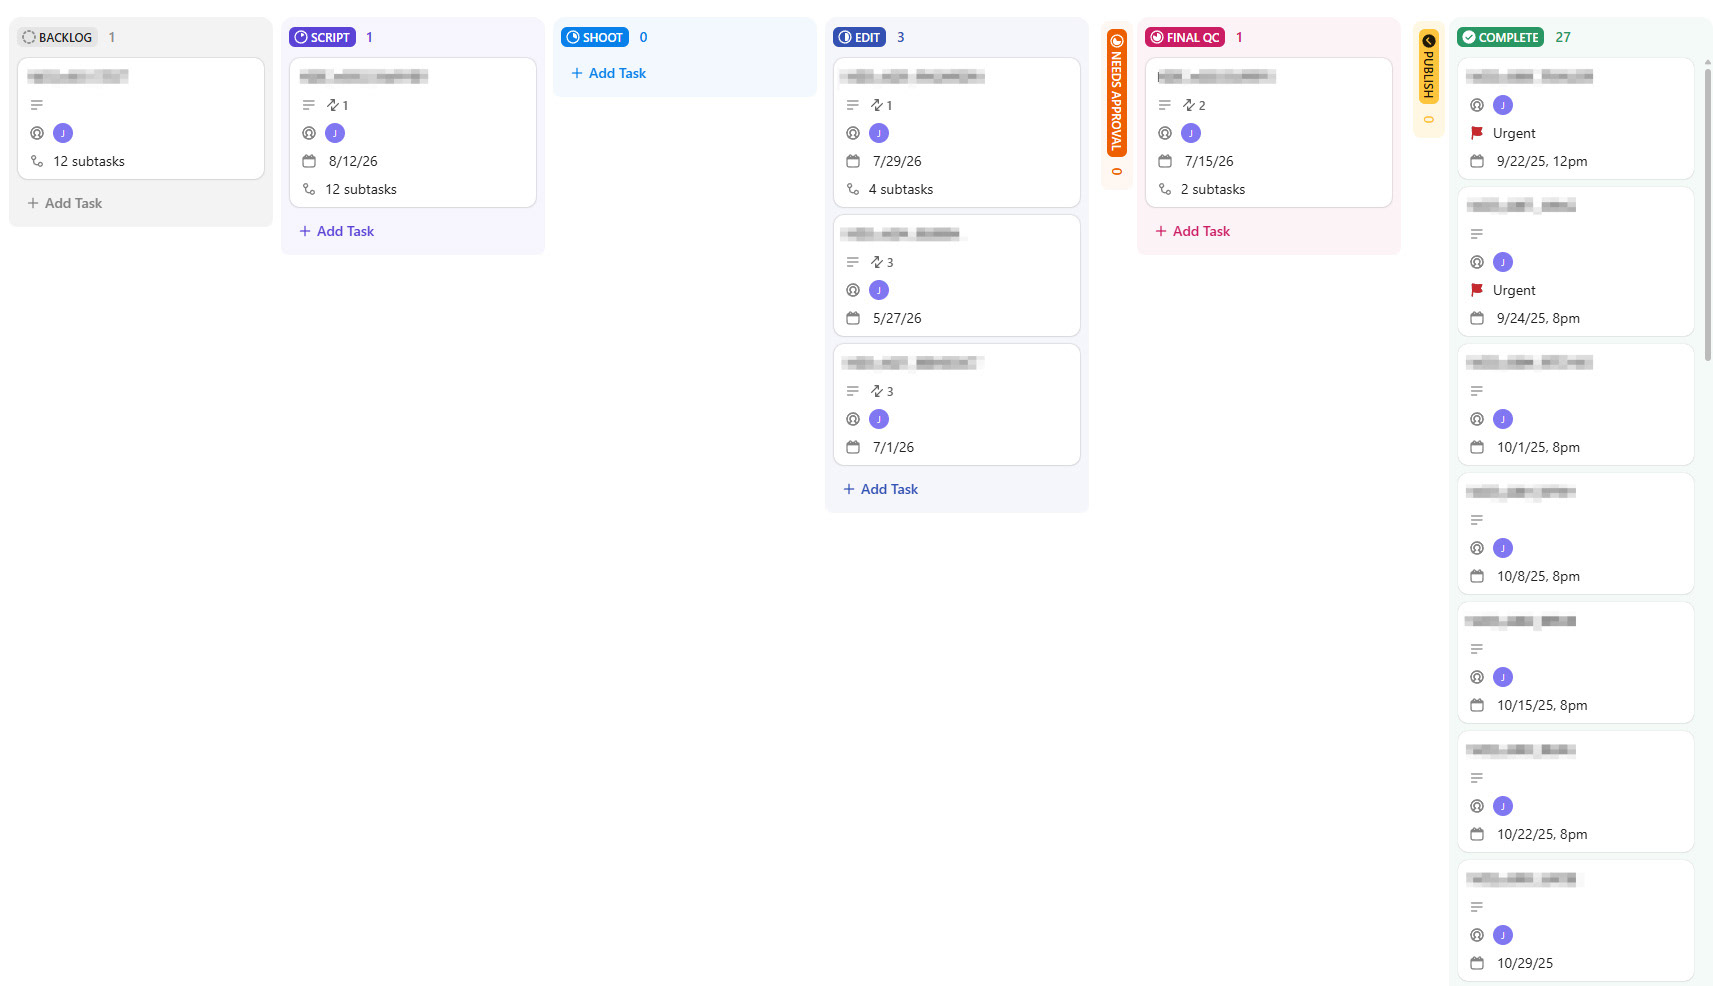
This is one product's workflow. Each project marches down the light from BACKLOG to SCRIPT to SHOOT and on until it meets our internal requirements for PUBLISH (and finally, COMPLETE). We have multiple ongoing products so keeping each part organized is essential for meeting our release objectives.
Challenge
The team needed a clearer way to manage multiple concurrent productions: long-form episodes, clips, shorts, member content, and new series launches. Without a centralized system, deadlines, bottlenecks, and workload issues could become difficult to see until they were already affecting output.
The goal was to create a workflow that made production status visible, helped the team anticipate what was coming next, and allowed leadership to understand where risks were forming before they became release problems.
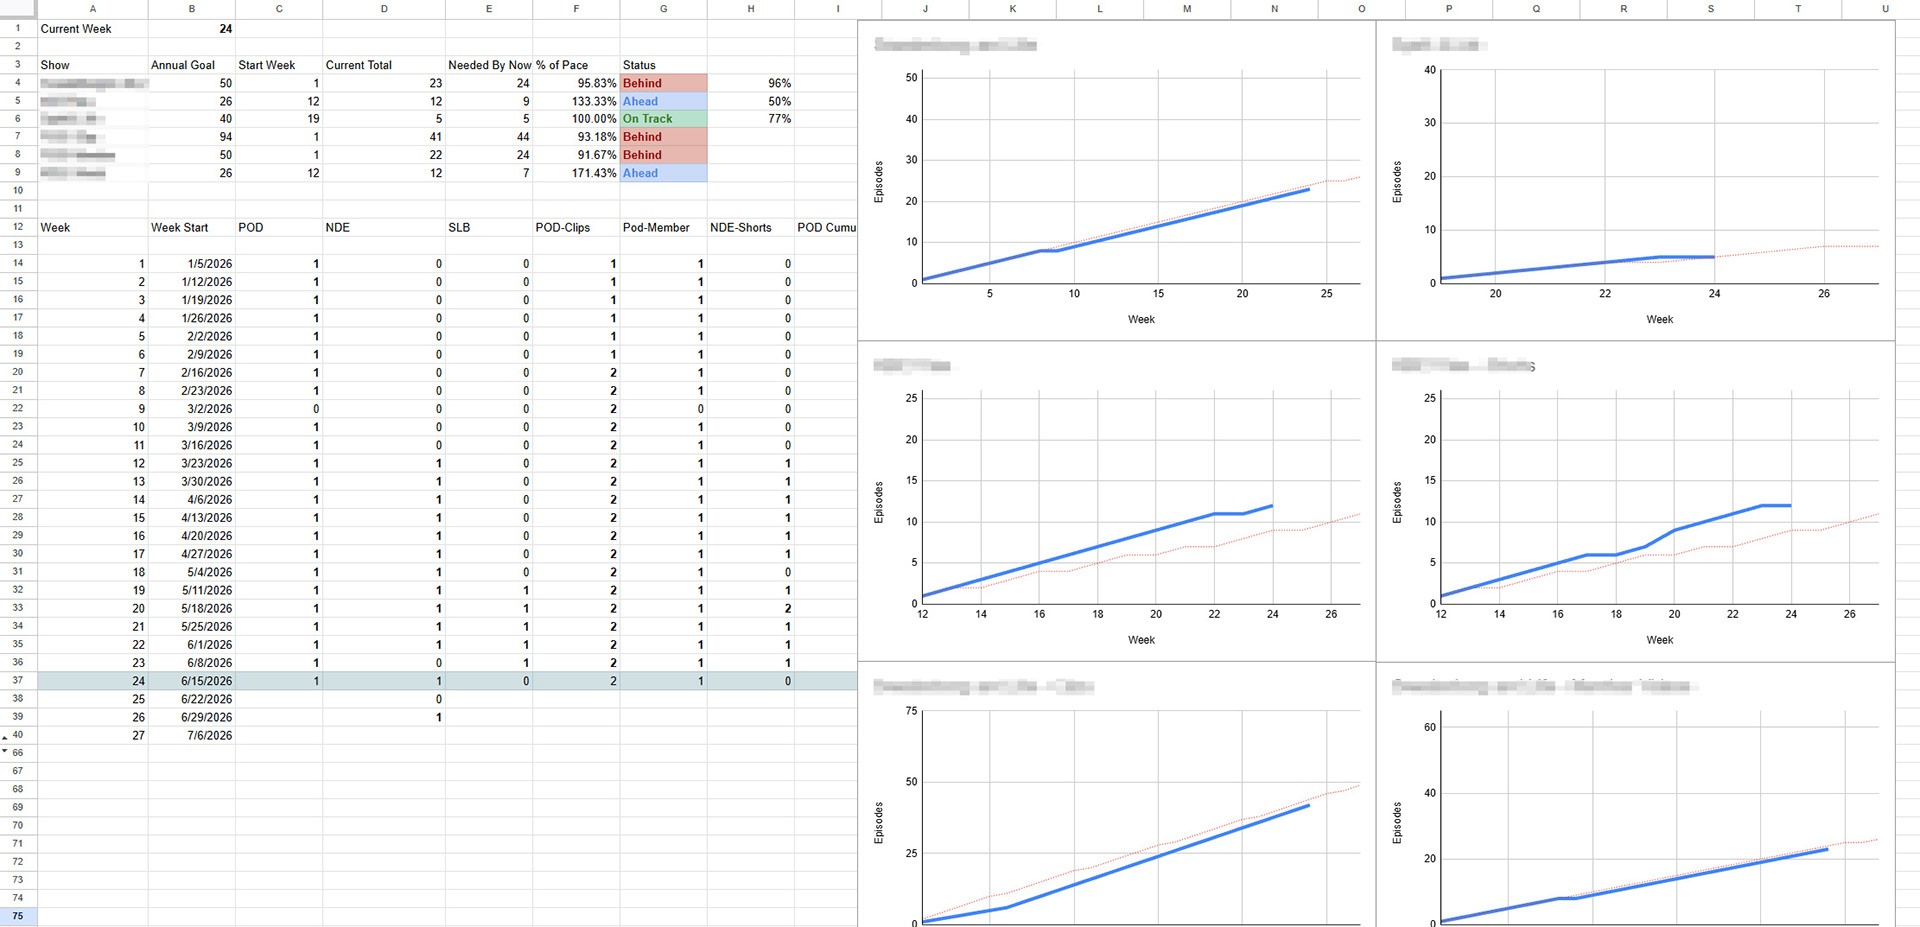
I customized this Google Sheet to help the team track each of our releases so that we could compare them to our internally defined goals.
System Design
The production system was built around three core needs:
Visibility into what is overdue, upcoming, or at risk
Clarity around where work is getting stuck in the pipeline
Alignment between weekly output and annual production goals
This included centralized ClickUp dashboards, structured production lists, workload visibility, recurring team check-ins, and a goal-tracking system comparing actual releases against expected output.
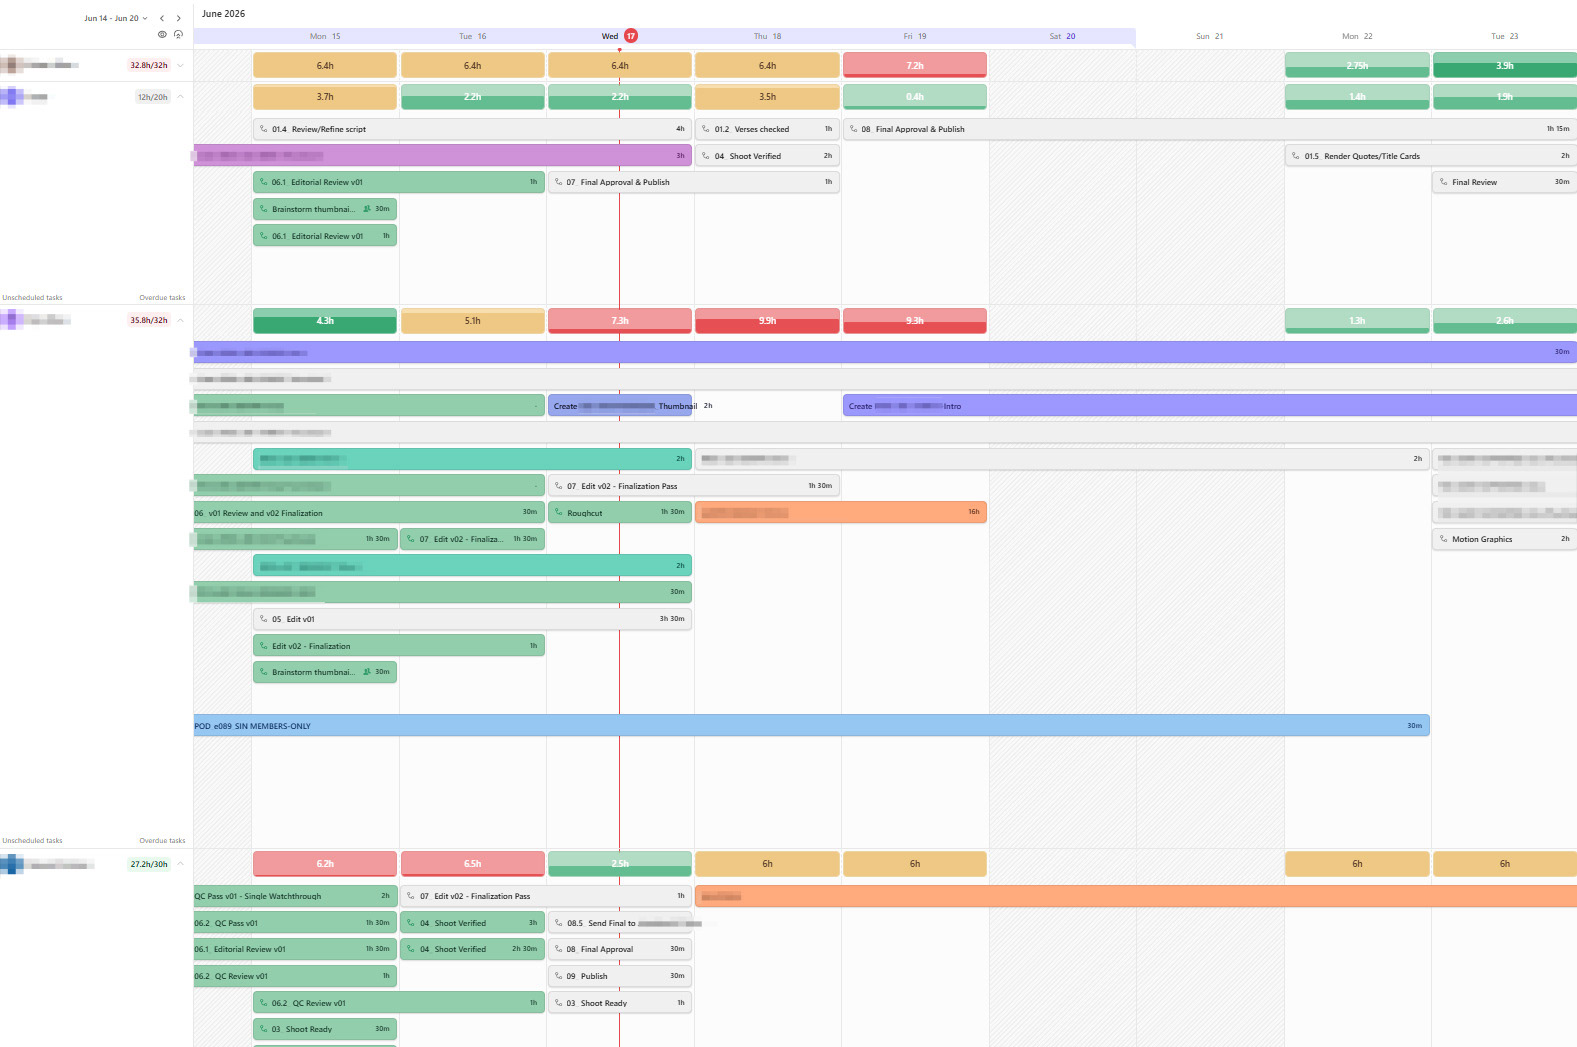
Here is an example of our Workload in a given week. This allows us to see where we are heavy or light and can help easily identify upcoming bottlenecks.
Execution
The system supports planning, scripting, filming, editing, publishing, clips, shorts, and member content across multiple channels. It gives team members a clearer sense of what is coming next, helps distribute work more effectively, and reduces dependence on reactive problem-solving.
The structure also allows project ownership to shift to other team members without losing visibility, making the production process more repeatable and less dependent on one person holding the entire map in their head.
Outcome
Built centralized production infrastructure supporting multiple concurrent shows and formats
Helped sustain 300+ pieces of content annually across long-form, clips, and short-form formats
Supported ~96% weekly release consistency across primary programming
Enabled increased output without proportional increases in staffing
Improved leadership visibility into production status, risks, workload, and capacity
Transitioned execution ownership to team members while maintaining system-level oversight